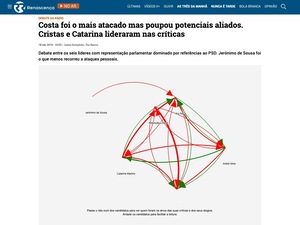
During a debate with all candidates on the parliament election, we tracked every interaction during the debate and classified them to visualize who was the most attacked and who interrupted more the other candidates.
Using that data gathered during the debate, I’ve used d3.js to transform it into a graph.
