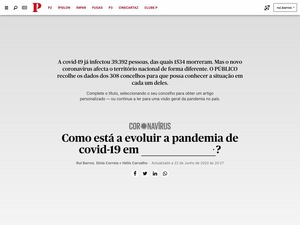
With the covid-19 pandemic impacting our daily lives, the media started to report on national numbers of cases. But, as a reader, I always wanted to check how the number of cases was evolving in the municipalities where people I cared about lived. The Portuguese government was publishing daily numbers by municipality and there were quite a few dashboards already. But could those numbers be turned into local personalized stories?
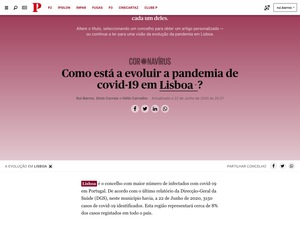
Using that data, information about those municipalities - like the number of people over 65 years old - we used code and data to turn it into a personalized news story about a place. The main goal was to provide a brief news story that, using charts and text, that not only provided a general view of the country, how the pandemic is evolving nationally, but also supply additional context about the place where I live or where people I care live at.
That way we were able to avoid only presenting numbers to the readers. We gave them a coherent news story that was personalized and unique, placing data in context.
Because most of the time these types of pieces always sound like “robot-made”, our journalists spent a huge amount of time iterating through all possible data outcomes just to make the story sound like it was written by a human to that specific location.
This interactive feature was widely used by our readers, mostly because it gave them a custom overview about their municipality, they couldn’t find elsewhere online, especially with the decreasing number of local news publishers.
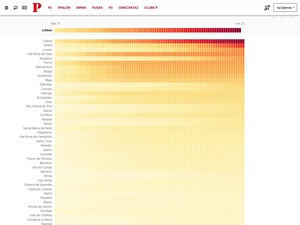
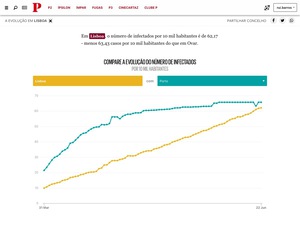
Because every municipality had a unique url, people could also bookmark the link to the place where they lived (skipping a more general text) and share on social media the personalized news piece about that place. That lead to an increase in the number of readers that used the link of the place where they lived/cared about to keep informed about the covid-19 on those places without missing the general context - the generated text informed people about the national numbers, the place with more cases and the place where the numbers increased the most in the last seven days, for example.
The data that was feeding the project needed to be scraped from PDFs afterwards with our custom model computing some statistical information to deliver the piece, which made daily updates were a challenge. This led some of our readers to send emails asking for updates. something that, in my opinion, showed how impactful the work became.
Unfortunately, the Portuguese government decided to stop publishing daily updates on the local numbers and started publishing just weekly data on municipalities. That made our work impossible to update because we needed to re-write everything from scratch.