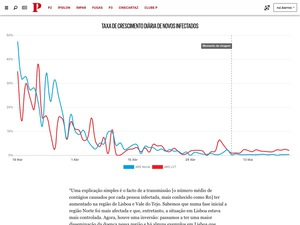
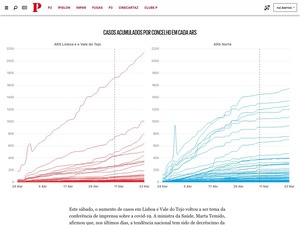
Using covid-19 data, I was able to show that, in May, seven in every ten new cases of covid-19 were located in the Lisbon region.
Apart from doing the data analysis, and while another reporter tried to understand why things were so different between the North (where the first cases were identified) and the Lisbon region, I’ve developed some interactive charts for this article.
It was especially impressive to see through a data visualization how differently covid-19 was spreading in different municipalities.


