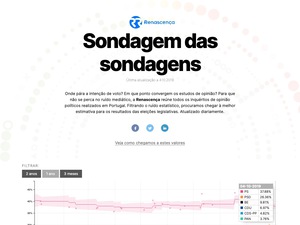
Before any elections, media outlets get flooded with polls and enquiries to try to determine who is the likely winner. But polls are a messy thing: they rely on different samples and every news outlet never consider margin errors or other details when reporting on them.
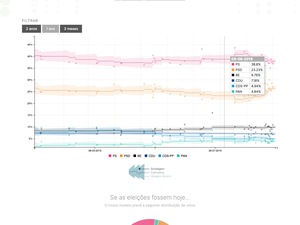
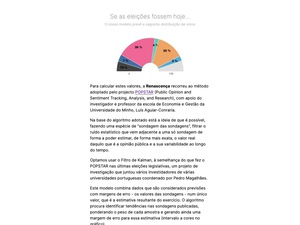
Inspired by the more complex models developed by FiveThirtyEight, NYTimes or The Economist, to name the few, I’ve partnered with Luís Aguiar-Conraria, an economy professor that was part of POPSTAR (Public Opinion and Sentiment Tracking, Analysis, and Research), to develop a model where we apply Kalman’s filter to all polls published in the last two years to get a more reliable metric about how public opinion feels towards the six most voted parties.
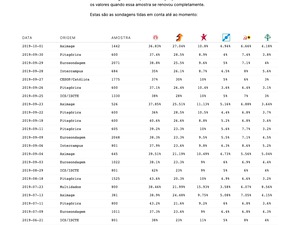
In Portugal it’s mandatory to publish all polls and their methodologies in a website. Because this data is published in very different forms using pdfs, I’ve started by manually collecting all that data to a spreadsheet. After having the data, we used news articles to complete the missing data (pollsters only need to publish that a few days after they release the info).
Having all the data, I’ve developed an R model that applied Kalman’s filter to the data, predicting value and error margins, and outputting everything into a .json file hosted on Gitlab. That same file was used as a data feed to the website that I’ve helped to develop where we used billboard.js to to show the model predictions right before the national parliamentary elections.


