A national lockdown was something new for everyone. And everyone felt that the country was changing. But how much? And what was changing? I’ve turned into data.
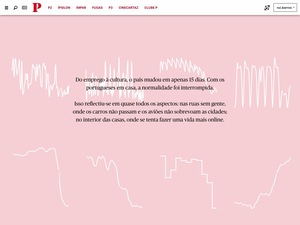
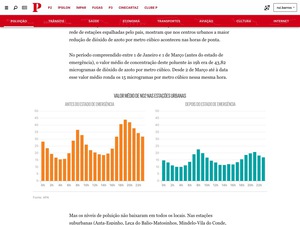
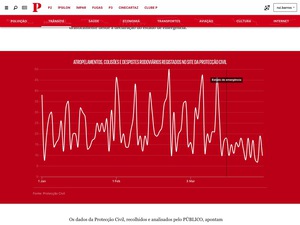
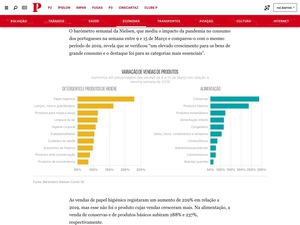
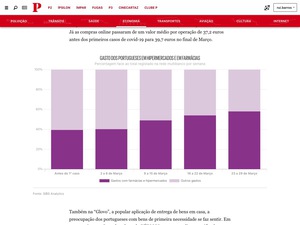
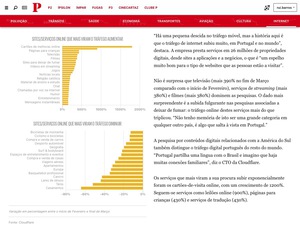
For this project, I’ve collected data from about 20 different data sources to try to understand how the country changed in 15 days. This revealed a lot about Portugal during such strange times - how much less pollution we were producing, how much less physical money we were using, how the number of car accidents decreased, how much fewer job postings we were seeing.
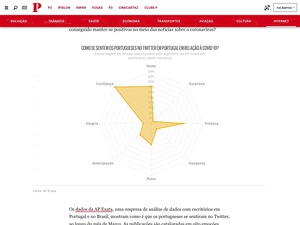
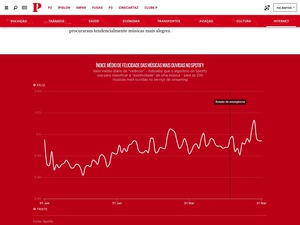
Some of the data revealed on this big data project: pollution data, traffic, car accidents, NHS usage, number of job postings, number of movie tickets sold, what kind of websites we were using more - like porn websites - and kind of music people were listening.
This was probably one of my most ambitious data projects because I’ve tried to get data about everything. I’ve used R to scrape and gather a lot of this data and turn it into .json data to feed the article. And I’ve done the web development and data visualizations that are part of it.
