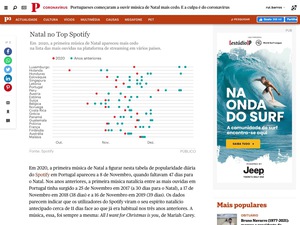
In 2020, the Portuguese started listening to Christmas songs 11 days earlier than usual. I’ve scraped Spotify’s Charts data to get the most listened songs for the last four years. Then searched for the names of the 10 most listened songs names (and more 90 Christmas related words in all languages) to identify when was the first time in a year a Christmas song appeared on this list.
Because this was the kind of article that I did in my free time, I had the opportunity to start to develop my first ggplot2 custom style. The infographics team at Público has a guide style for charts, but everything is done using Illustrator. Trying to speed up things a bit, I’ve started to develop what will probably be PublicoR - an R package for everything data journalism related at Público.

