“Público” is well known for its “Ranking das Escolas” - a big feature work where we analyze school results, rank them, and do a lot of data analysis to figure out what are the major problems in the education system. But one of the biggest critics about this data - that now almost newsroom covers - is that by ranking schools you don’t take into consideration social and economic factors. After all, data shows that schools in poorer areas perform worst.
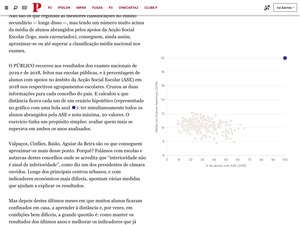
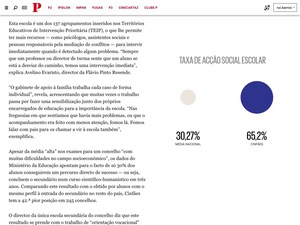
That’s why this year we’ve decided to tackle this question. I’ve used the data for all exams made by the municipality and calculated the average value of the marks on each exam. Then, using the social-economic data given by the Education Ministery, we were able to get the percentage of students that had some kind of help from the government because of their parents’ income - what is called “Ação Social Escolar (ASE)” in Portugal.
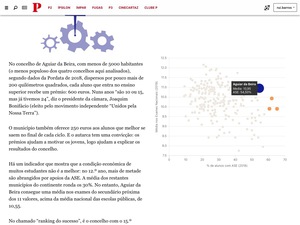
Plotting the two variables in a scatter plot, I’ve calculated the euclidean distance of all municipalities to the ideal point - a hypothetic municipality where they had 100% of the students with ASE and 20 as a mean of their school results. This way we were able to find 4 municipalities that, even though didn’t have the highest marks, had good marks for the big percentage of students in economic difficulties that lived there.
We talked with the school directors of those four school municipalities and also with the local government representatives to try to understand was the formula to contradict the national trend.
Because the methodology of this work was somewhat hard to explain to my readers, I’ve developed a scrollytelling article to explain what I did and then show the data about those schools.


